
Operational systems
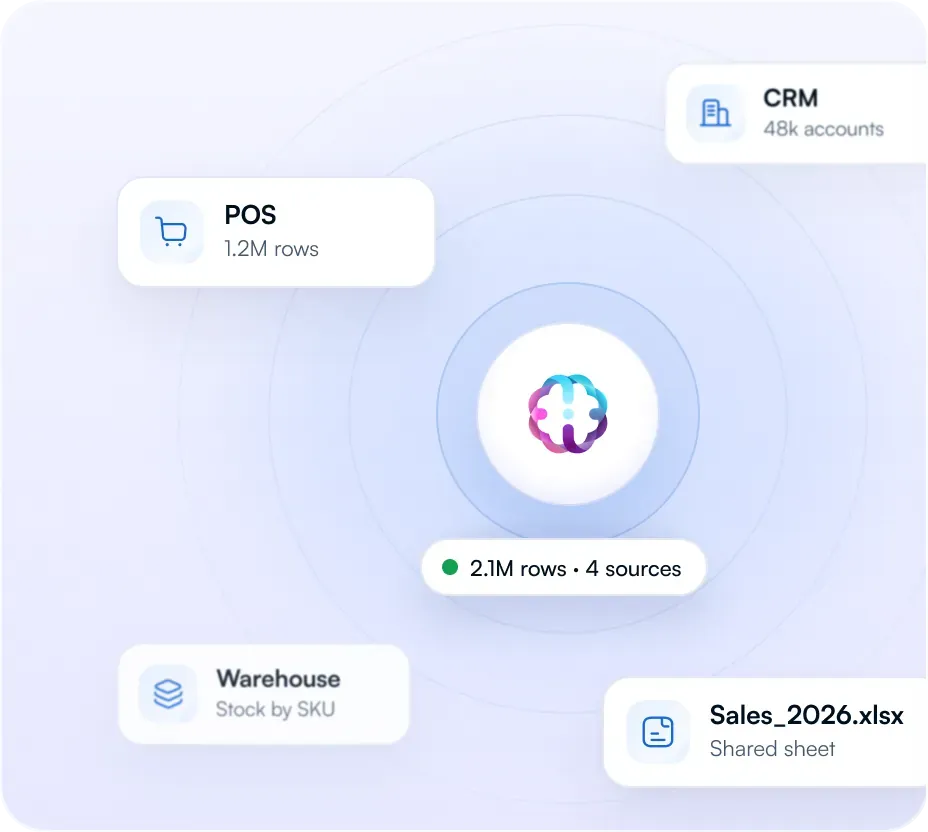
Sales, stock and finance straight from the systems that run the business.
- POS
- CRM
 AI Data Analysis
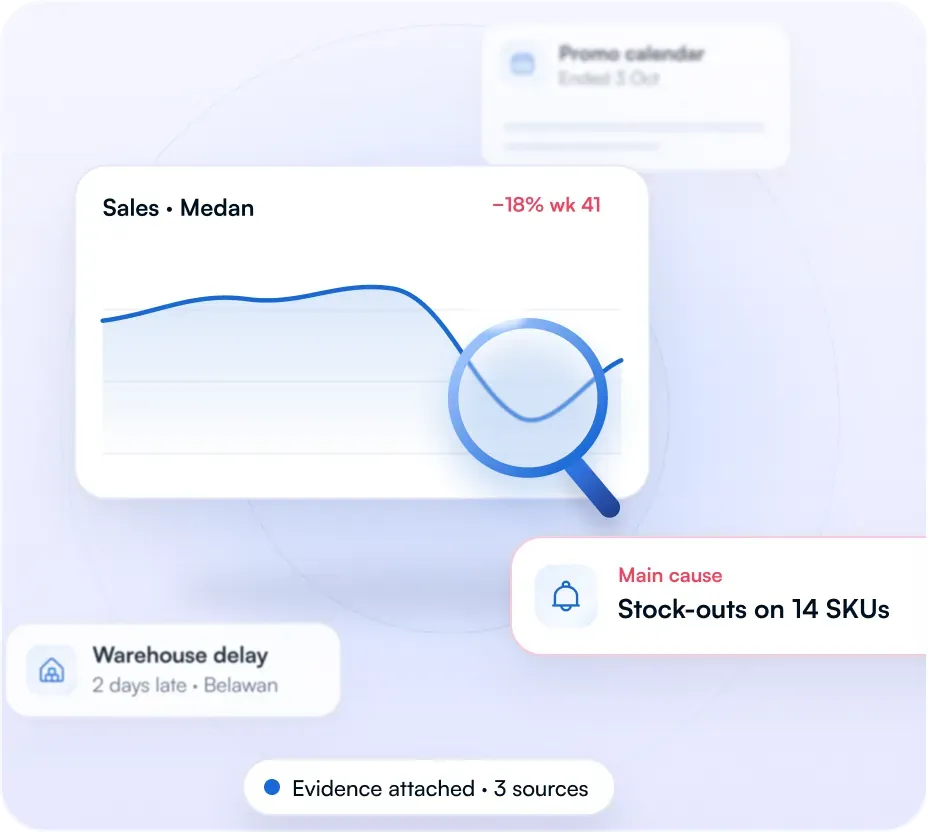
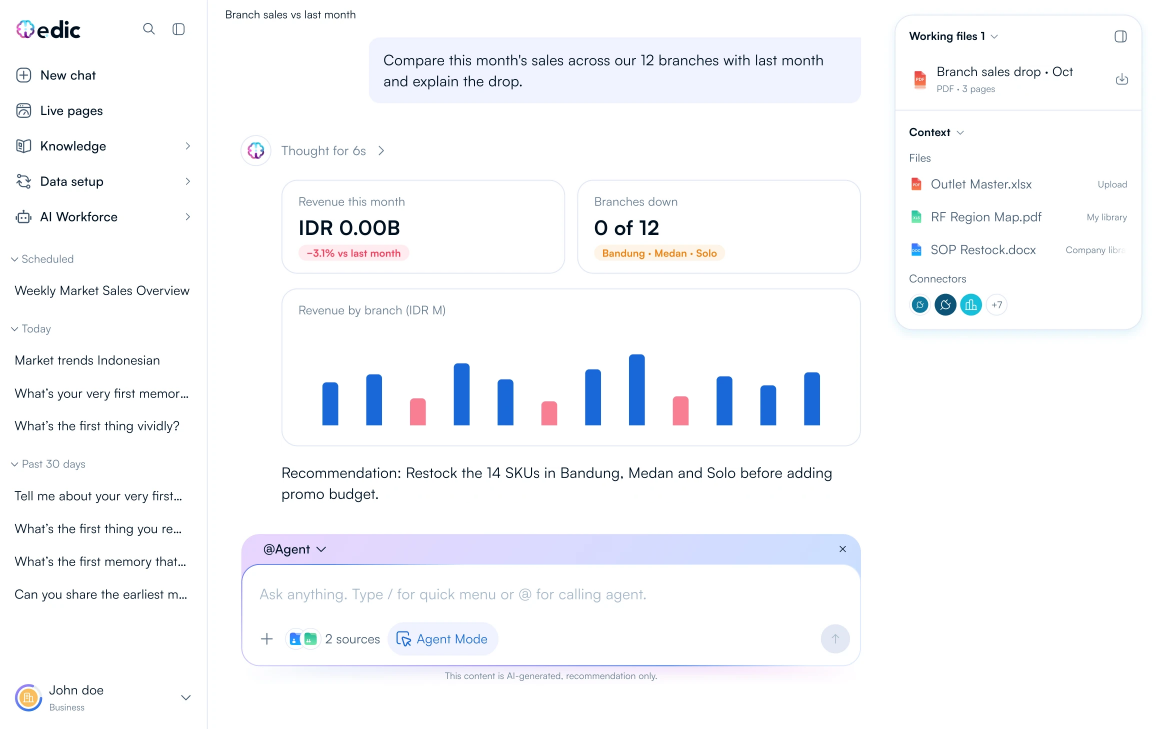
Ask a business question in plain language. edic pulls data from your connected systems, finds the pattern, explains what caused it, and builds the charts and slides around it.
Overview
Curated models
Each request is routed to the model that does that task best, then assembled into one answer. Your team sees one platform.
Your request
“Board deck for this month”“Why did margin drop?”“Summarize 40 supplier contracts”“Turn this PDF into a chart”
edic routes
Picks a model per task
Numbers model
Tables, KPIs, varianceNot needed here
Document model
PDFs, contractsNot needed here
Narrative model
Commentary, summaryNot needed here
Slides model
Layout, charts, deckNot needed here
One coherent output
Board deck · 12 slidesAnswer + chart · 3 causesSummary · 40 contractsEditable chart · from PDF
How it works
01
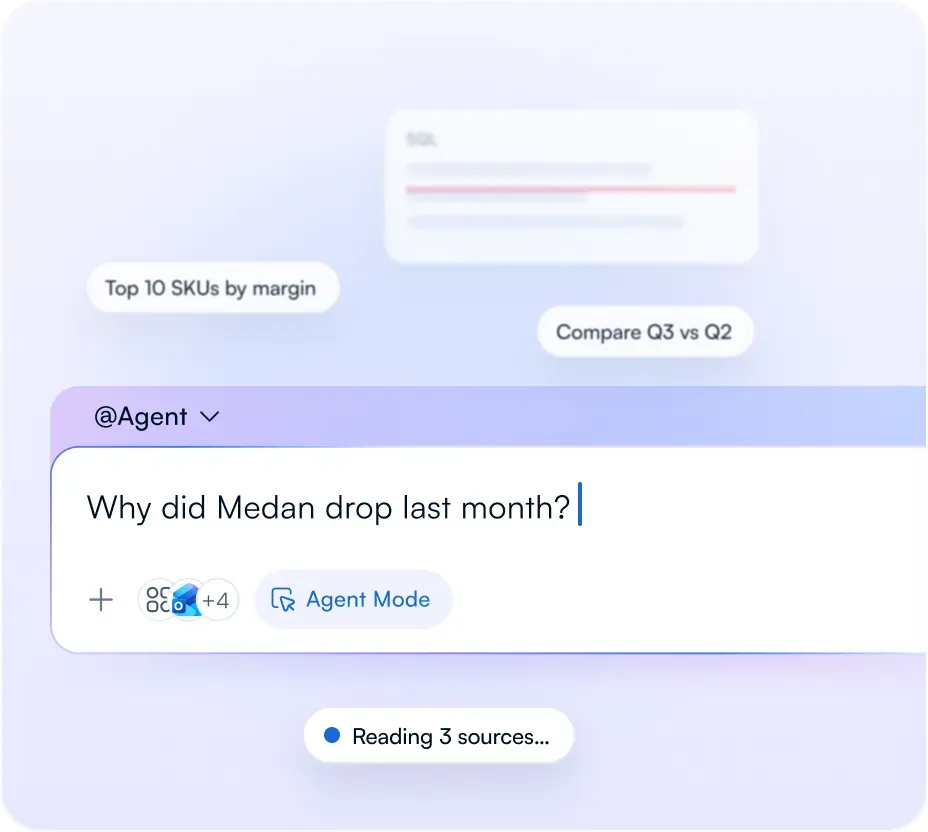
Type the question the way you’d ask a colleague. No SQL, no formulas.
Step 1 of 4
Data sources
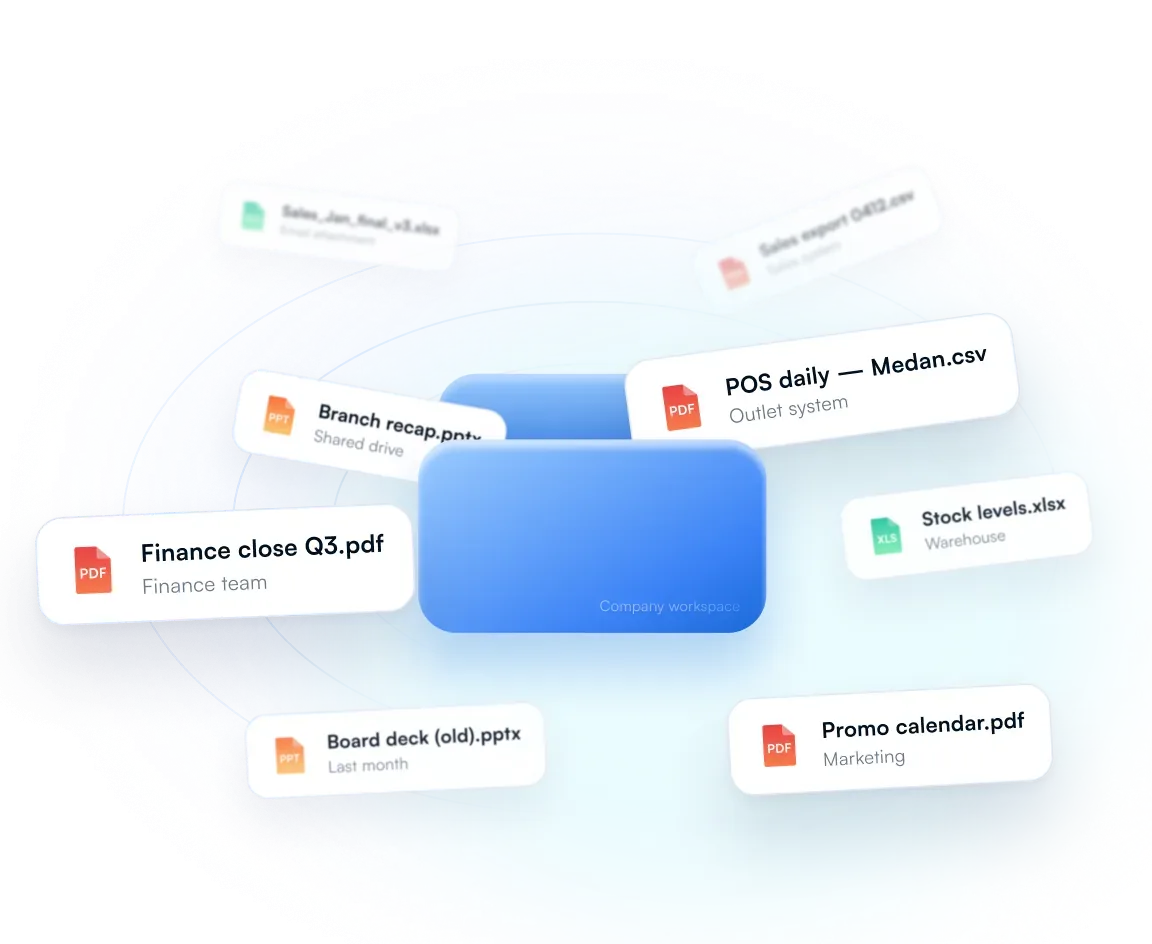
Structured or still in spreadsheets, edic connects to what’s already in place.
Sales, stock and finance straight from the systems that run the business.

Excel, CSV, PDF, Google Sheets, SharePoint
No Migration.
Keep your systems.
Use cases
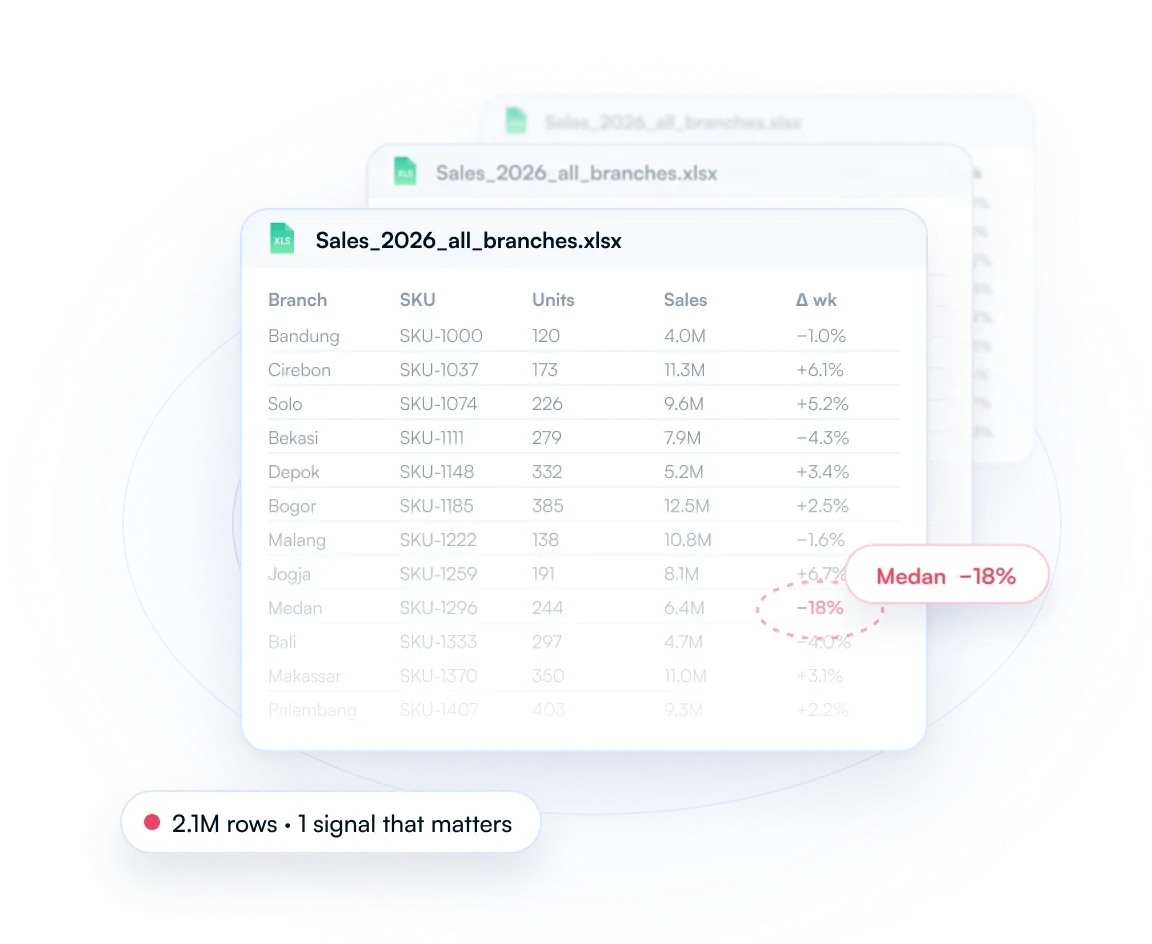
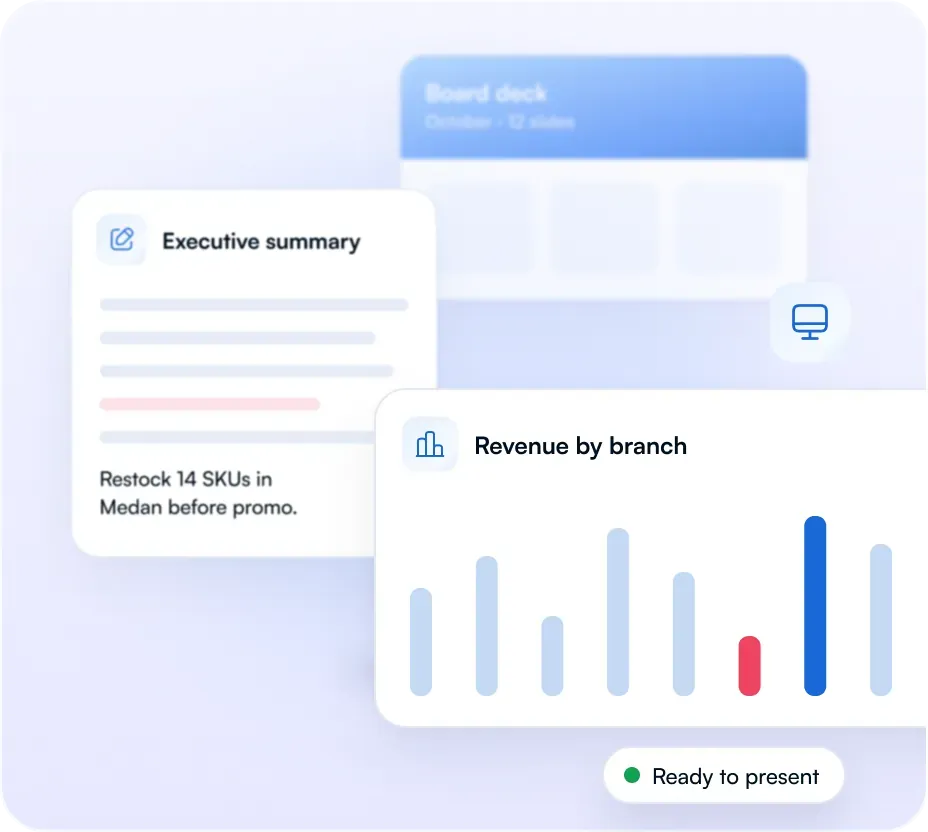
Combine sales across branches, see trends and product contribution, and get the report as a deck.
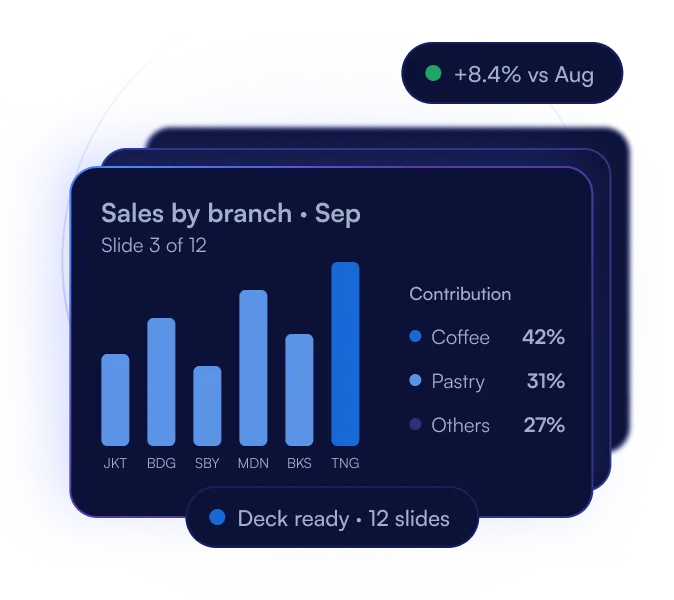
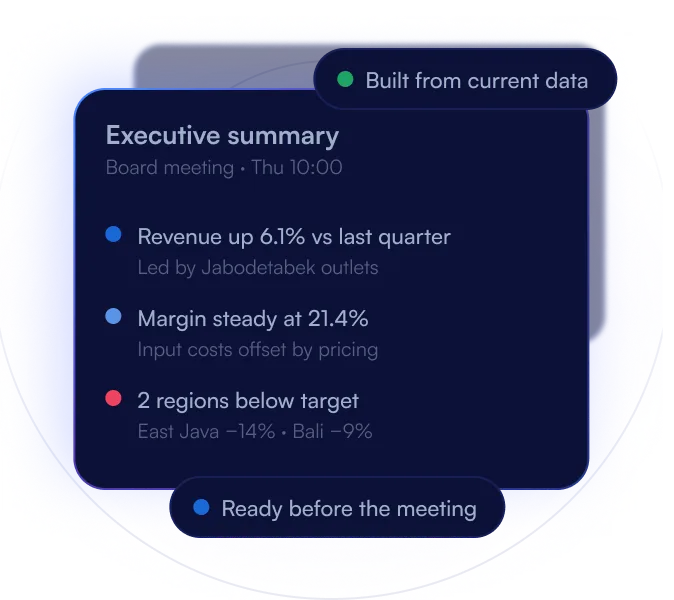
Executive summaries and meeting material from current data, without waiting on a team recap.
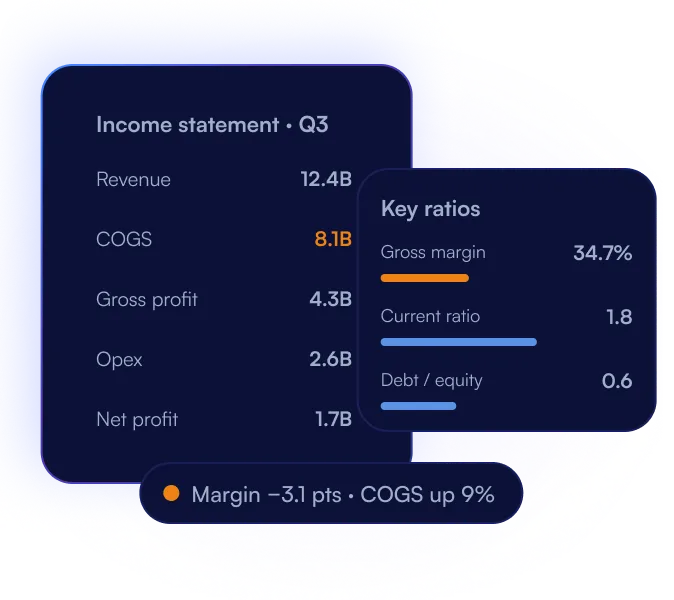
Read statements, calculate key ratios, and get an explanation of what moved and why.
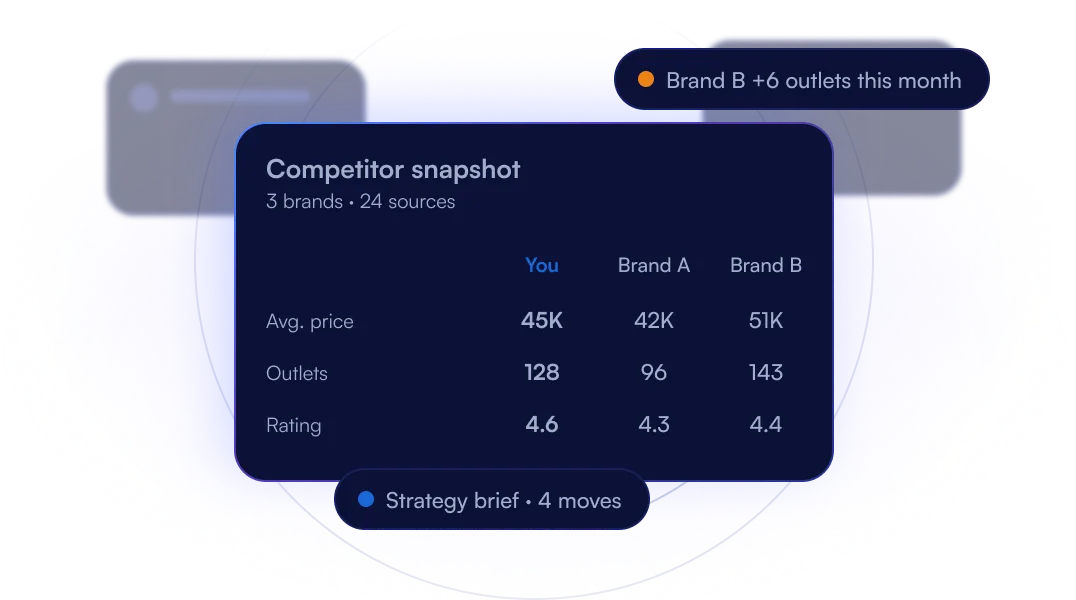
Collect and compare competitor information, then turn it into strategy material.
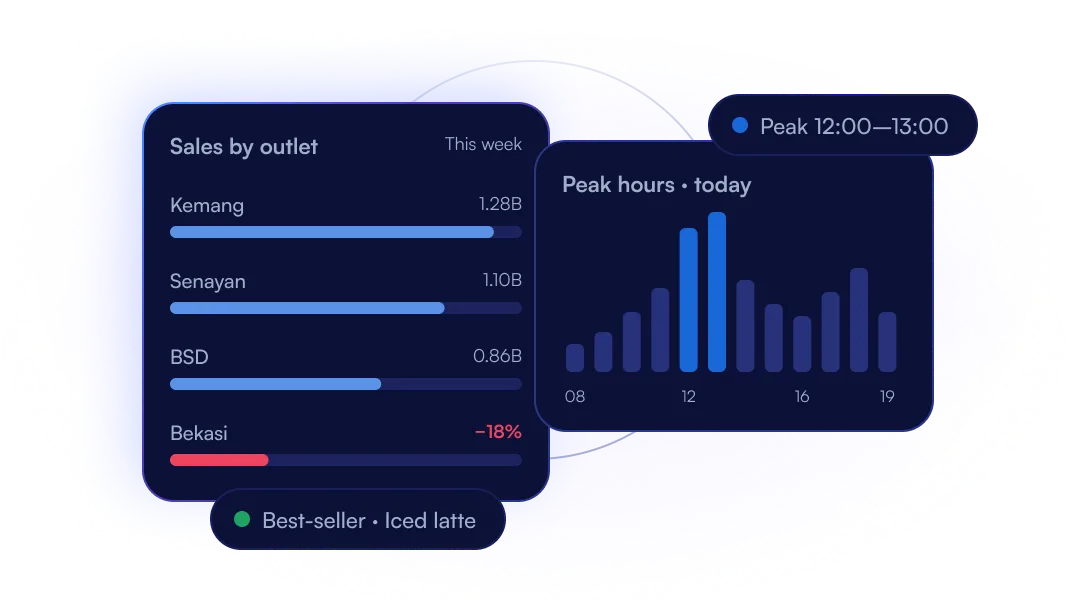
Process POS reports to see best-sellers, peak hours and performance by outlet.
Why choose us
 General AI chat
edic picks the model best suited to each task, then combines the results.
General AI chat: One model for every kind of task.
Analysis runs on live figures from your connected systems.
General AI chat: Only reads the file you upload that moment.
You get a deck, report or chart that is ready to share.
General AI chat: Text you still have to assemble yourself.
Learns your terms, KPIs and data structure, so answers get sharper over time.
General AI chat: Starts from zero in every chat.
Not answered here? Our team is happy to help.
It reads company data from multiple sources, finds the patterns, explains what caused the numbers to move, and turns the result into charts, reports and decks.